Difference between revisions of "Lake Jersey Refinement Example AB"
From WikiROMS
Jump to navigationJump to search| Line 10: | Line 10: | ||
==Results== | ==Results== | ||
The plots below show the results after 2 days of simulation for one-way and two-way nesting configurations. They are plotted with Matlab using the script plot_nesting.m. The refined solution (grid b) is overlayed on top of the coarse grid (a). The color map is rendered using shading flat, meaning there is no interpolation between pixels in the color maps. Click the figure to see a more detailed image. On the resulting page a link to the full resolution image is provided. | The plots below show the results after 2 days of simulation for one-way and two-way nesting configurations. They are plotted with Matlab using the script plot_nesting.m. The refined solution (grid b) is overlayed on top of the coarse grid (a). The color map is rendered using shading flat, meaning there is no interpolation between pixels in the color maps. Click the figure to see a more detailed image. On the resulting page a link to the full resolution image is provided. | ||
<gallery widths=500px heights=350px perrow=2 caption="Surface Temperature"> | <gallery widths=500px heights=350px perrow=2 caption="Surface Temperature (Celsius)"> | ||
Image:lake_jersey_temp_oneway_2g_ab.png|<center>One-way</center> | Image:lake_jersey_temp_oneway_2g_ab.png|<center>One-way</center> | ||
Image:lake_jersey_temp_twoway_2g_ab.png|<center>Two-way</center> | Image:lake_jersey_temp_twoway_2g_ab.png|<center>Two-way</center> | ||
| Line 22: | Line 22: | ||
<gallery widths=500px heights=350px perrow=2 caption="Free-surface"> | <gallery widths=500px heights=350px perrow=2 caption="Free-surface (m)"> | ||
Image:lake_jersey_zeta_oneway_2g_ab.png|<center>One-way</center> | Image:lake_jersey_zeta_oneway_2g_ab.png|<center>One-way</center> | ||
Image:lake_jersey_zeta_twoway_2g_ab.png|<center>Two-way</center> | Image:lake_jersey_zeta_twoway_2g_ab.png|<center>Two-way</center> | ||
| Line 28: | Line 28: | ||
<gallery widths=500px heights=350px perrow=2 caption="3-hour Averaged Vertically Integrated Relative Vorticity"> | <gallery widths=500px heights=350px perrow=2 caption="3-hour Averaged Vertically Integrated Relative Vorticity (1/s)"> | ||
Image:lake_jersey_rvorticity_bar_oneway_2g_ab.png|<center>One-way</center> | Image:lake_jersey_rvorticity_bar_oneway_2g_ab.png|<center>One-way</center> | ||
Image:lake_jersey_rvorticity_bar_twoway_2g_ab.png|<center>Two-way</center> | Image:lake_jersey_rvorticity_bar_twoway_2g_ab.png|<center>Two-way</center> | ||
</gallery> | </gallery> | ||
Revision as of 19:29, 8 December 2014
Lake Jersey Nesting Refinement Example
| Example Menu |
|---|
| 1. Introduction |
| 2. Lake Jersey AB |
| 4. Lake Jersey AC |
| 3. Lake Jersey AD |
| 5. Lake Jersey ABD |
| 7. Lake Jersey ADE |
| 6. Lake Jersey ABDC |
| 8. Lake Jersey ACDE |
Description
Results
The plots below show the results after 2 days of simulation for one-way and two-way nesting configurations. They are plotted with Matlab using the script plot_nesting.m. The refined solution (grid b) is overlayed on top of the coarse grid (a). The color map is rendered using shading flat, meaning there is no interpolation between pixels in the color maps. Click the figure to see a more detailed image. On the resulting page a link to the full resolution image is provided.
- Surface Temperature (Celsius)

One-way 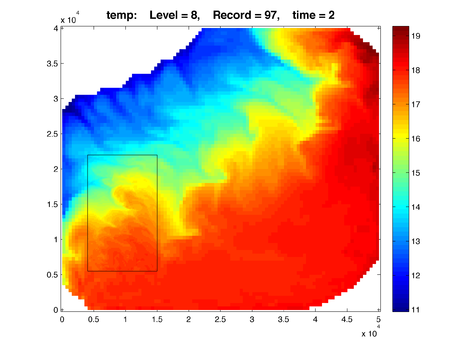
Two-way


- Surface Salinity

One-way 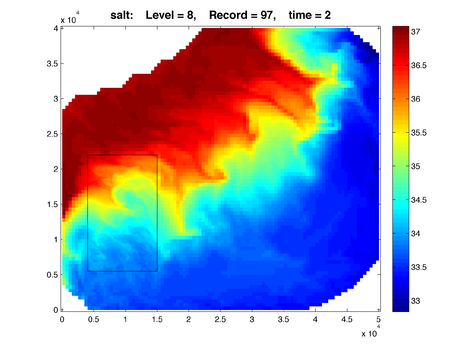
Two-way


- Free-surface (m)

One-way 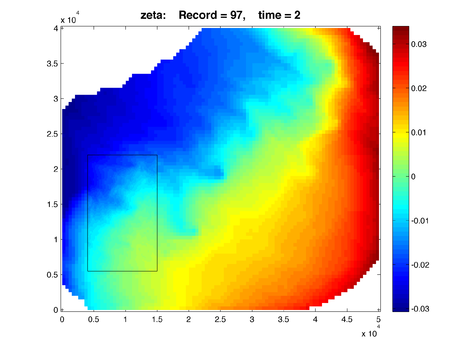
Two-way


- 3-hour Averaged Vertically Integrated Relative Vorticity (1/s)

One-way 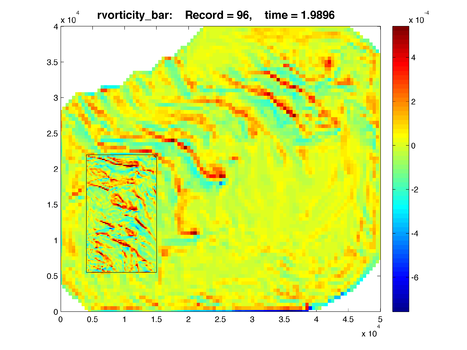
Two-way

