Difference between revisions of "SHOREFACE CASE"
| Line 5: | Line 5: | ||
Haas and Warner (2009). Comparing a quasi-3D to a full 3D nearshore circulation model: SHORECIRC and ROMS, Ocean Modelling, 26, 91-103. | Haas and Warner (2009). Comparing a quasi-3D to a full 3D nearshore circulation model: SHORECIRC and ROMS, Ocean Modelling, 26, 91-103. | ||
The case consists of spectral waves approaching a mild sloping (1/80) plane beach with an oblique angle of incidence. The wave forcing is obtained by first running SWAN separately by specifying a JONSWAP spectrum for 2 m offshore wave height with a peak period of 10 s at an angle of 10 degrees for the incoming wave field. SWAN was configured to use 90 directional bins and 30 frequency bins between 0.04 and 0.5 Hz | The case consists of spectral waves approaching a mild sloping (1/80) plane beach with an oblique angle of incidence. The wave forcing is obtained by first running SWAN separately by specifying a JONSWAP spectrum for 2 m offshore wave height with a peak period of 10 s at an angle of 10 degrees for the incoming wave field. SWAN was configured to use 90 directional bins and 30 frequency bins between 0.04 and 0.5 Hz. | ||
The output from SWAN was made into the ROMS forcing file: | The output from SWAN was made into the ROMS forcing file: | ||
Revision as of 21:36, 3 February 2009
This test establishes a simple case of spectral waves obliquely approaching a plane beach and is described in detail in:
Haas and Warner (2009). Comparing a quasi-3D to a full 3D nearshore circulation model: SHORECIRC and ROMS, Ocean Modelling, 26, 91-103.
The case consists of spectral waves approaching a mild sloping (1/80) plane beach with an oblique angle of incidence. The wave forcing is obtained by first running SWAN separately by specifying a JONSWAP spectrum for 2 m offshore wave height with a peak period of 10 s at an angle of 10 degrees for the incoming wave field. SWAN was configured to use 90 directional bins and 30 frequency bins between 0.04 and 0.5 Hz.
The output from SWAN was made into the ROMS forcing file: Data/ROMS/Forcing/swan_shoreface_angle_forc.nc
The circulation model computes the radiation stress forcing based on the SWAN wave output. For this application there is not a feedback of the currents to the wave model. Also we neglect the contribution from the roller model. The circulation model uses a quadratic bottom stress formulation using the depth average currents.
Results are shown after the model reaches steady state.

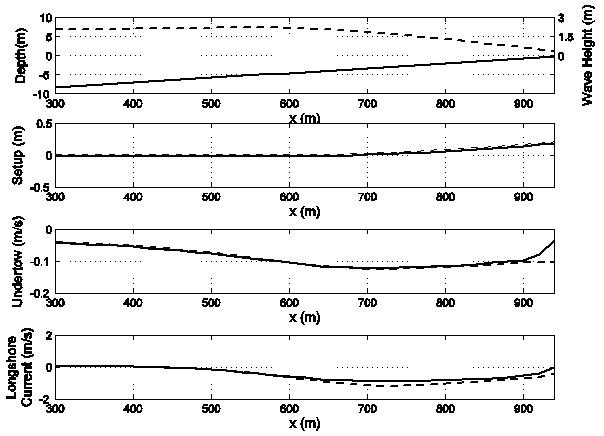
The cross-shore profiles of water depth and SWAN computed
wave height are shown in Fig. 1a. The waves shoal as they enter
the domain, although this is somewhat counteracted by dissipation
due to bottom stress making the shoaling difficult to visualize from
the wave heights in Fig. 1a. The waves begin to decrease near
x = 600 m due to wave breaking dissipation. The wave fields computed
from SWAN are used in each circulation model to compute
the radiation stress forcing. The depth-averaged forcing as computed
by each circulation model is identical, and is also identical
to the forcing as computed from SWAN (not shown). Because the
depth average forcing is the same, the resulting wave setup
(Fig. 1b) is very similar for the two models. Similarly the depth
averaged undertow and longshore currents (Fig. 1c and d) match
for the two models, except near the shoreline. The differences near
the shoreline are due to different treatment of the flow at the
shoreline by the models. SC imposes a zero velocity shoreline condition
while ROMS has a free slip shoreline condition. Overall, it is
clear that with the same depth averaged forcing, and using the
same bottom stress formulation, the quasi-3D and fully 3D models
give very similar results for the depth averaged flow features.
Therefore the redistribution of longshore momentum in the
cross-shore direction due to the turbulence and vertical variation
of the currents is similar for the two models.
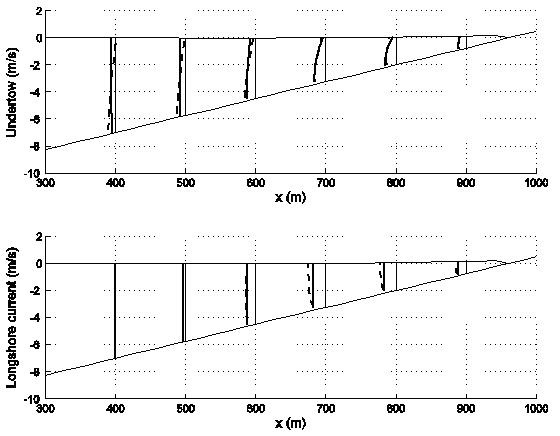
However, the depth varying radiation stress components computed in each circulation model are different. The vertical structure of the longshore and cross-shore currents is shown in Fig. 2. Both models produce the classical undertow profile (e.g. Svendsen 2006, chapter 12) inside the surf zone (x > 700 m) with strong return flow in the lower part of the water column and weaker flow in the upper part of the water column. Outside the surf zone (x < 600 m), SC is producing undertow with fairly depth uniform or a slightly increased flow near the surface in accordance with Putrevu and Svendsen (1993), whereas,ROMSis producing undertow which is still stronger in the lower part of the water column, albeit with much less curvature than inside the surf zone. Both models predict longshore current profiles inside the surf zone which are stronger near the surface than
near the bottom, although with less curvature than for the undertow as expected. The curvature for the results from ROMS is a bit larger than the results from SC.
