File:cost fig5.png
Original file (995 × 811 pixels, file size: 23 KB, MIME type: image/png)
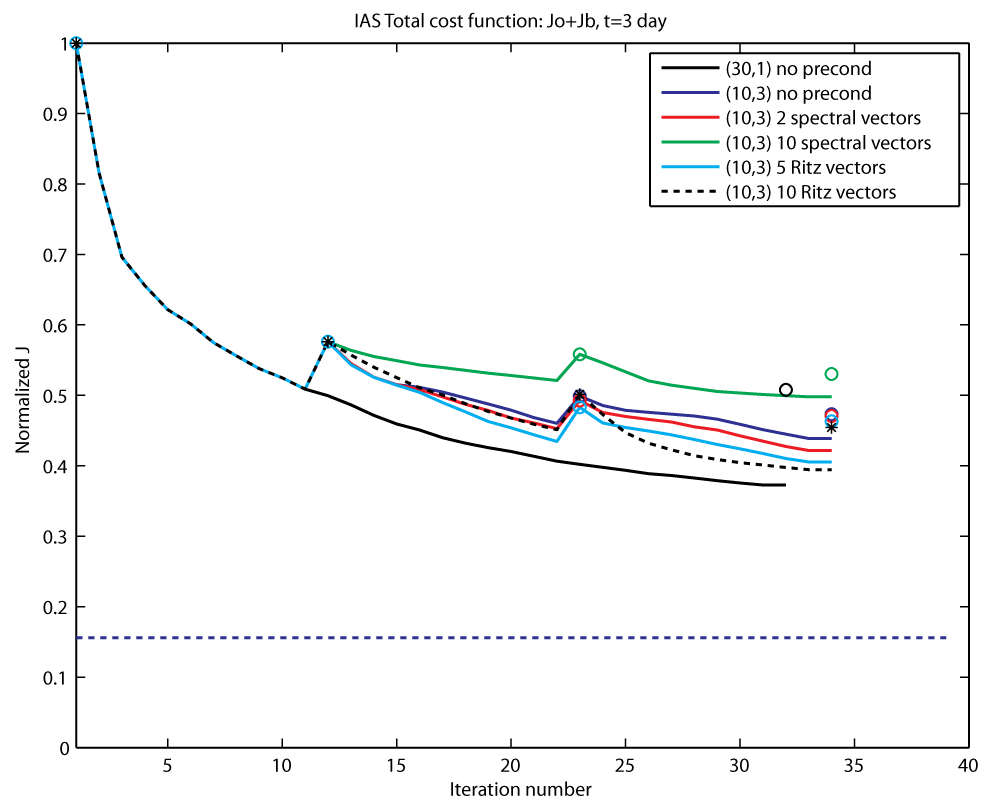
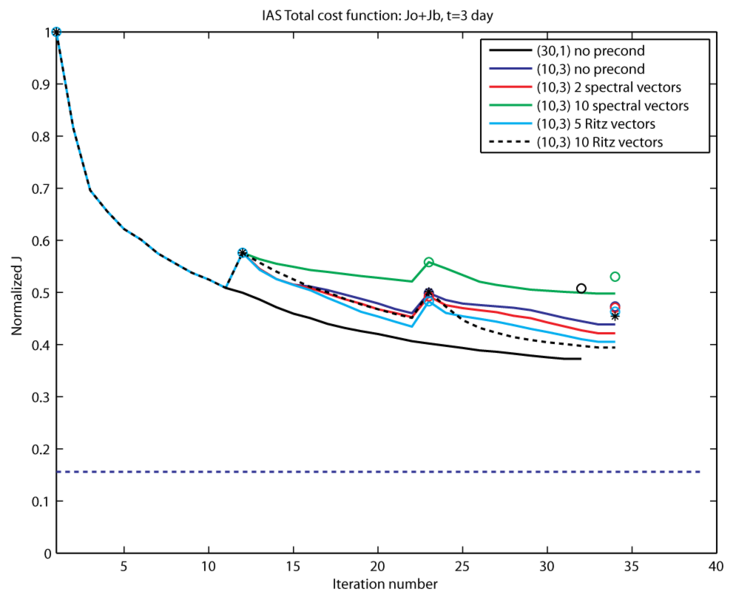
The normalized cost function J computed within inner-loops (curves) and JNL the cost function computed relative to the nonlinear model during outer-loops (open circles). The various cases shown are for a 3-day assimilation window: (30,1) no preconditioning (solid black curve, black circles); (10,3) no preconditioning (solid dark blue curve, blue circles); (10,3) and spectral preconditioning using 2 eigenvectors (red curve, red circles), and 10 eigenvectors (green curve, green circles); (10,3) and Ritz preconditioning using 5 Ritz vectors (turquoise curve, turquoise circle), and 10 Ritz vectors (black dashed curve, black asterisks). The horizontal dashed blue line represents the theoretical minimum value of the cost function given by half the number of assimilated observations.
File history
Click on a date/time to view the file as it appeared at that time.
| Date/Time | Thumbnail | Dimensions | User | Comment | |
|---|---|---|---|---|---|
| current | 18:30, 4 November 2008 | | 995 × 811 (23 KB) | Robertson (talk | contribs) | The normalized cost function J computed within inner-loops (curves) and JNL the cost function computed relative to the nonlinear model during outer-loops (open circles). The various cases shown are for a 3-day assimilation window: (30,1) no preconditionin |
You cannot overwrite this file.
File usage
The following page uses this file: